
Recent Projects
Check out some of my work and see how I can help you


Data Analysis
Project for analysis and visualization of impactful data.
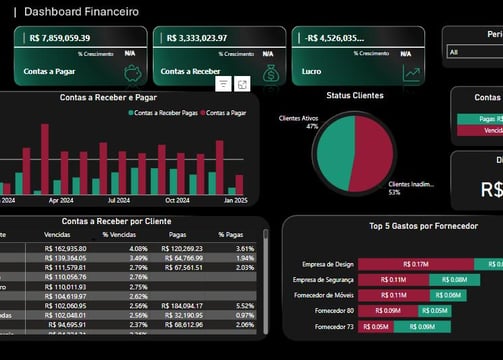
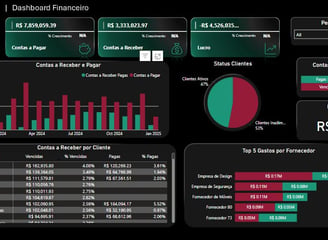
Interactive Financial Dashbord
Develop dynamic dashboard for budget control, cash flow forecasting and analysis of financial KPIs.


Interactive Visualizations
Creation of interactive dashboards for better data understanding.
Custom Reports
Detailed report that meet your specific needs.
Professional experience
My trajectory as a data analyst with projects that highlight skills in analysis.
Work focused on results.
Data Analyst
Relevant Projects
Financial
Jan 2025
Developed a dynamic dashboard for budget control, cash flow forecasting, and financial KPI analysis.
Tools used: Power BI, Advanced Excel (Power Query, PivotTables), SQL.
📈 Findings:
Reduced financial analysis time by 35% with report automation.
Data integration via ETL (SQL + Power Query), eliminating inconsistencies in 10% of records.
Monitoring of strategic KPIs to support financial management.
Outstanding Performance
Date World
Mar 2023 - Jan 2025
I implemented improvements that resulted in increased efficiency and customer satisfaction.
Supported the resolution of strategic problems, delivering solutions that resulted in an increase in operational efficiency through interactive dashboards developed in Power BI, Tableau and Data Studio
Automated administrative and reporting processes, reducing the time spent on manual tasks.
Generated organizational engagement by implementing gamification concepts, increasing adherence to key indicators by 30%.


Data Analytics Services
I offer accurate data analysis to boost your business and optimize results.


Data Analysis
I transform data into valuable insights for strategic business decisions.
Process Automation and Reporting
I help optimize processes and increase efficiency through Data Analytics.
Custom Reports and Interactive Dashboards
I create clear and objective reports to make critical data easier to understand.
Contact Us
Let's turn your data into valuable insights together!
Fill out the form and find out how I can help your company make smarter, more strategic decisions. 🚀
Talk
+55 91 996187519
Send
Contact
Let's turn your data into results!
Contact us and find out how data analysis can boost your business. 🚀
Services
Portfolio
+55 91 996187519