About Me
and
My Services
Data Analyst with more than 5 years of experience in the analysis and optimization of organizational processes. Specialist in the development of interactive dashboards, automation of administrative processes and analysis of KPIs to support decision making. Skill in tools such as Power BI, Excel, SQL, Python and ETL methodologies.


Exceptional service and impressive results.
Satisfied Customer
"
"
Professional experience
I am a data analyst with experience in projects that generate valuable insights.
I turn data into decisions.
Historic
Project Experience
Freelancer
2022 - Present
I worked on several projects, helping companies to optimize their operations.
I developed customized solutions for companies in different sectors. My main focus was to transform raw data into strategic insights through interactive dashboards, report automation, and optimization of financial and administrative processes.
💼 Main Projects:
Financial Dashboards for monitoring accounts payable, accounts receivable and cash flow analysis, allowing better budget control.
Process Automation using Excel (VBA), SQL and Power BI, reducing report generation time by up to 40%.
Data analysis and KPIs for business process optimization, identifying operational bottlenecks and growth opportunities.
Consulting in LGPD and Data Governance, helping companies to structure their databases and ensure compliance with legislation.
Relevant Projects
Data Analysis
2020 - 2025
I developed analyses that improved business performance in several companies.
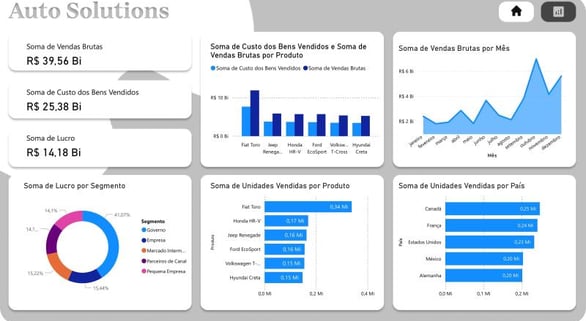
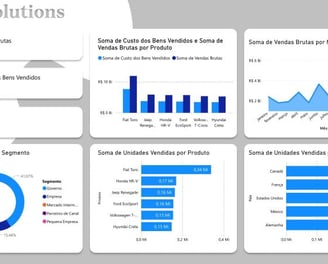
📊 Financial Dashboard for Accounts Payable and Receivable Management
Developed an interactive dashboard for financial monitoring, enabling greater control over cash flow and delinquency. The project helped reduce analysis time by 35% and facilitated the management of accounts payable and receivable.
📌 Automation of Human Resources Reports
I created an automated system for payroll processing and headcount control, reducing the time spent on repetitive tasks by 40% and ensuring compliance with the LGPD.
📈 Process Optimization and Predictive Analytics
Implemented data analysis models to predict trends and improve resource allocation. The project reduced the average response time for strategic decision-making by 28%.
🔐 Consulting in LGPD and Data Governance
Assisted companies in adapting to the LGPD, structuring anonymization and data protection processes, ensuring greater security and regulatory compliance.


The work was exceptional, exceeded my expectations and brought significant results to my project.
Mariana Silva

Remarkable professionalism and dedication, I recommend it to anyone looking for a competent and reliable data analyst.
Carlos Lima

★★★★★
★★★★★
Contact
Let's turn your data into results!
Contact us and find out how data analysis can boost your business. 🚀
Services
Portfolio
+55 91 996187519